
For those investing in individual stocks, being able to avoid companies with unfavorable earnings manipulation scores could be a valuable risk mitigation tool.
The Beneish M-Score model is likely one of the best screening methods available for detection of earnings manipulation. The “M” stands for manipulation.
As an individual investor, you are limited to the data provided by public companies to the SEC via their 10-K, 10-Q and other earnings calls and investor announcements.
Investors rely on the financial information provided as being audited by a public accounting firm and expect it to be materially accurate.
If the data is not accurate, or intentionally manipulated, an investor is putting their money at risk as the value of the stock might not be as high as it appears. The M-Score can help you make more informed investment decisions when buying individual stocks.
What is the Beneish M-Score?
The M-Score is a calculation invented by Professor Messod Beneish at Indiana University in 1999. The goal of the calculation is to use the company’s financial statements to get a score that will place a company in a category of either being (1) a potential earnings manipulator or (2) not being a potential earnings manipulator.
In his original paper, Professor Beneish stated that in the sample tests performed, the calculation identified about half of the companies who were earnings manipulators before it became public knowledge. That is a pretty good hit rate!
Students at Cornell University who managed an investment fund, used the M-Score to help determine that Enron was no longer a safe investment, and sold their holdings exactly one year before the company filed for bankruptcy.
Like any metric, it is not guaranteed to always work. However, all things being equal, if you had two potential investments that were of equal interest, and one had a good M-score and the other had a poor one, which one would you choose for your investment?
Components of the M-Score
The M-Score has eight separate metrics. The result of each of the eight metrics and its quotient is summed up, and the result is the score.
The basic equation: -4.84 + Sum of (quotients times each of the 8 metric scores) = M-Score. We’ll get into the specific details of this calculation later on.
The eight metrics are as follows:
1. Days Sales in Receivables (DSRI)
2. Gross Margin Index (GMI)
3. Asset Quality Index (AQI)
4. Sales Growth Index (SGI)
5. Depreciation Index (DEPI)
6. SG&A expenses Index (SGAI)
7. Leverage Index (LVGI)
8. Total Accruals to Total Assets (TATA)
Results of the M-Score
Interestingly, the key dividing line of the M-Score result is a negative 2. Again, the number is -2. Technically it is -1.78, but it is okay to round it to -2 to cast a wider net of potential manipulators.
In the results of the calculation, a higher score is worse than a lower score. With -2 being the dividing line, a score greater than -2 (such as -1 or -0.5) would have a much higher probability of manipulation than a lower score, such as -2.5.
Most companies put in the effort needed to maintain good internal controls and internal audit processes to greatly reduce the risk of errors and irregularities of the financials. However, we all know that accounting includes a lot of estimates and reserves that can have a degree of subjectivity to them. In addition, there are ranges of values that might be considered acceptable.
For example, a company could reduce reserves for potential losses within a reasonable acceptable reserve range. They might do this in order to help improve the profit results in the current quarter or year. This can be considered a form of earnings management.
What if a company is making a significant number of bookkeeping reserve adjustments in order to improve its earnings? If these become material to the financial statements it crosses the line from earnings management to earnings manipulation. In that case the financials are no longer properly stated according to Generally Accepted Accounting Principles (GAAP).
This is what the M-Score is attempting to identify.
Looking at the details of the M-Score calculation
Let’s take a closer look at this mathematical model in more detail.
The basic equation presented earlier has a little more to it. The exact equation is presented in the following formula:
M-Score formula = -4.84 + 0.92*DSRI + 0.528*GMI + 0.404*AQI + 0.892*SGI + 0.115*DEPI – 0.172*SGAI – 0.327*LVGI + 4.679*TATA
Once you get the scores for each of the eight metrics, you just plug them into the M-Score equation and get the result.
Of course, each of the metrics has a calculation in and of itself. You are essentially doing eight separate calculations to get the metric values and then plugging them into the formula to get the final M-score result.
Getting the Data
For public companies, the data needed for the calculation can be found in the SEC filing called a 10-K, which contains the annual report of financial results. Since the report provides the current year and the prior year data, you need just one 10-K report to get the data needed for the calculations.
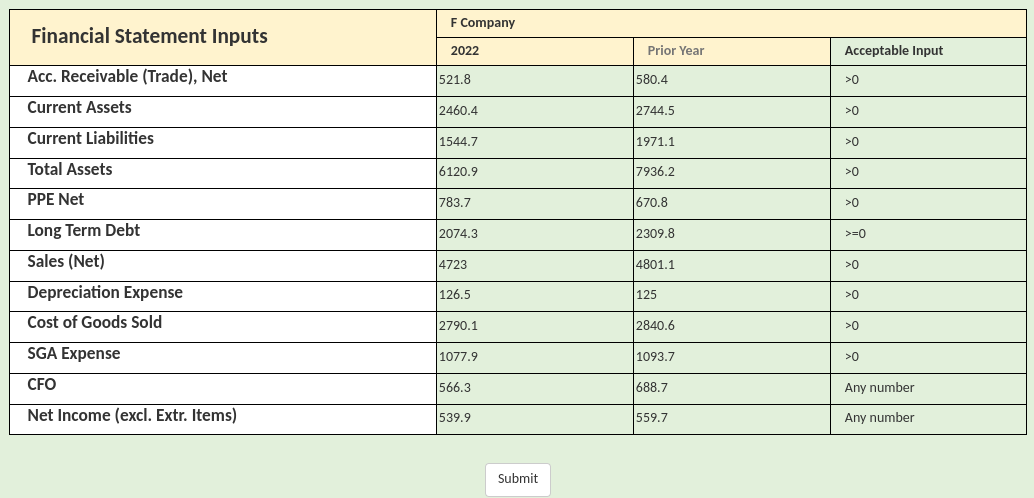
To test drive the calculation process I picked a public company that we’ll call “Company F.” I pulled its 10-K from the free online Electronic Data Gathering and Retrieval Service (EDGAR) from the SEC.
We will use their data for each of the metrics and determine the M-Score. Note that the values presented in their balance sheet, income statement and cash flow statement are in millions. It really doesn’t matter if the numbers are in millions or thousands, as long as the numbers are using the same dollar measures.
Metric 1: Days Sales in Receivables Outstanding Index (DSRI)
In order to get this value, use the following formula:
DSRI = (Current Year Receivables balance / Current year sales) / (prior year Receivables balance / Prior year sales)
DSRI = (521.8 / 4723) / (580.4 / 4801.1) = 0.914
The concept is that a large increase in Receivables compares to Sales from the prior year to the current year can be associated with a higher probability that revenues are inflated.
Metric 2: Gross Margin Index (GMI)
GMI = (Prior year Gross Margin / Sales) / (Current year Gross Margin / Sales)
GMI = (1960.5 / 4801.1) / (1932.9 / 4723) = .408 / .409 = 0.998
The idea with this metric is that a gross margin deterioration is an unfavorable dynamic. Companies with a deterioration of their gross margins have more pressure related to earnings improvement. A result greater than one means that the gross margin has deteriorated in the current year. The larger the number, the higher the deterioration.
Using our sample company, the gross margin has improved slightly from 40.8% to 40.9%, so there is no deterioration.
Note that Gross Margin = Sales – Cost of Goods Sold
Metric 3: Asset Quality Index (AQI)
AQI = (1 – [(Current year Current assets + Current year Net Property Plant & Equipment) / (Current year total assets)] ) / (1- [(Prior year current assets + Prior year Net Property Plant & Equipment) / (Prior Year total assets)])
AQI = (1- [(2460.4 + 783.7) / (6120.9)]) / (1- [(2744.5 + 670.8) / (7936.2)]) = 0.4699 / 0.5696 = 0.825
The metric is measuring the ratio of non-current assets (except Property Plant & Equipment) to total assets of the current year divided by the same ratio of the prior year. If the ratio is greater than one it means there has been a relative increase in asset realization risk, which could suggest cost deferral attempts. Essentially this ratio is removing the hard dollar current assets and fixed assets, which leaves other assets and intangibles including goodwill if applicable.
The formula is backing into the non-current assets number by taking one minus the current assets plus PPE. This is because there are lots of different categories of non-current assets, which makes getting the numbers off of the 10-K easier.
Metric 4: Sales Growth Index (SGI)
SGI = Current Year Sales / Prior Year Sales
SGI = 4723 / 4801.1 = 0.984
The purpose with this metric is to determine if there has been a significant increase in sales from the prior year. A significant increase in sales growth can also be a red flag for potential earnings manipulation.
Metric 5: Depreciation Index (DEPI)
DEPI= (Prior year depreciation / (Prior year depreciation + Prior year PPE)) / ((Current Year depreciation / (Current year depreciation + current year PPE))
DEPI= (125 / (125 + 670.8)) / (126.5 / (126.5 + 783.7)) = .1571 / .1390 = 1.130
An index score greater than one indicates that the rate of depreciation has slowed down, which could mean the firm has revised its useful lives of assets to stretch them out or possibly adopted a new depreciation method that reduces depreciation expense.
PPE = Property Plant & Equipment = Fixed Assets
Metric 6: SG&A expenses index (SGAI)
SGAI = (Current year SG&A expenses / Current year sales) / (Prior year SG&A expenses / Prior year sales)
SGAI = (1077.9 / 4723) / (1093.7 / 4801.1) = 1.002
This metric is looking at the ratio of expenses to sales. A big change in the proportion could be a symptom of manipulation.
SG&A = Selling, General & Administrative expenses
Metric 7: Leverage index (LVGI)
LVGI = [(Current year Long Term Debt + Current Year Current Liabilities) / Current Year Total Assets] / [(Prior year Long Term Debt + Prior Year Current Liabilities) / Prior Year Total Assets]
LVGI = [(2074.3 / 1544.7) / 6120.9] / [(2309.8 / 1971.1) / 7936.2] = .5912 / .5394 = 1.096
This metric is capturing how much leverage the company is taking on relative to assets in the current year versus the prior year. More debt can sometimes be a sign of financial distress.
Metric 8: Total Accruals to Total Assets (TATA)
TATA = (Current year net income before extraordinary items – Current year cash flows from operations) / Current year Total Assets
TATA = (539.9 – 566.3) / 6120.9 = -0.004
The original formula had a lot of balance sheet items in the numerator. The updated formula (used above) is simpler and easier to implement. Essentially the formula is extracting the operating cash flow from net income. If the numerator is above one and quite high, it means there is a higher likelihood of accrual adjustments adding to net income.
Calculating the M-Score
To calculate the M-Score for our sample company F we plug the numbers from above into the equation:
M-Score formula = -4.84 + 0.92*DSRI + 0.528*GMI + 0.404*AQI + 0.892*SGI + 0.115*DEPI – 0.172*SGAI – 0.327*LVGI + 4.679*TATA
The M-Score for our sample company = -4.84 + 0.92*0.914 + 0.528*0.998 + 0.404*0.825 + 0.892*0.984 + 0.115*1.130 – 0.172*1.002 – 0.327*1.096 + 4.679*(-0.004)
M-Score formula = -2.683 for our sample company F.
Since the score is below -2 there is a low probability that the company is an earnings manipulator in the years being reviewed using the M-Score process.
Using the Online Tool
Here is the link to the online M-Score Calculator from professor Beneish at Indiana University you can use to determine the score for any public company once you obtain the financial statements. I plugged in the numbers for the sample “company F” and it confirmed the score of -2.683 which shows that this company is not likely to be an earnings manipulator.
Here is the input page with the numbers entered. Once you hit submit you get the output page.
The output also has a nice graph that shows the ranges. Here are the images from the Beneish M-Score Online Calculator for our sample company.


Final Thoughts
In summary, to perform the M-Score calculation for any public company, you just need their 10-K that you can obtain from the SEC EDGAR website and then plug the numbers into the Beneish M-Score online calculator. It’s pretty easy.
Why not give it a try when looking at your next stock investment opportunity as another screening tool?
Note that companies and management can change over time. A company that once ran a tight ship could become an earnings manipulator later on. Running this calculation periodically for existing stock investments can be a way to keep tabs on this risk. Also note, as mentioned above, that this tool is not guaranteed. It won’t catch everything. It is another tool in your toolbox to use with other screening methods.
Executive Summary: Using the M-Score to Detect Earnings Manipulation
- Investing in individual companies has risks, and using screening tools can mitigate risks
- The Beneish M-Score model is a highly regarded math model to help detect financial statement manipulation
- The model can be seen as a forensic accounting tool
- A poor score means their is a much higher likelihood of earnings manipulation
- The model uses eight metrics that are part of an equation that calculates a score
- The score tells you if the company has a higher or lower probability of earnings manipulation
- You can quickly get the financial data needed for the calculation from the annual reports provided by public companies
- The 10-K report will give you both the current and prior fiscal years information you need for the calculation
- Most of the metrics are comparing the current year to the previous year ratio or year-over-year increase in search of the effects of manipulation
- Both the 10-K data and the Beneish M-Score calculator are available online for you to run the calculation for any public company (links provided above)
Other Articles to Read and tools to use:
- Difference of a Fee-Only vs Fee-Based Financial Advisor
- Use the Longevity Illustrator to Plan your Retirement
- Best Small Cap Index ETFs to compliment your Equity Portfolio
- Personal Financial Check-up online tool
- Avoid hidden hotel fees with ResortFeeChecker.com
- Understanding the Difference of Revenue vs Cash Flow