Truflation is a private independent data service calculating inflation whereas the Consumer Price index (CPI) is calculated by the Bureau of Labor Statistics (BLS), a United States government agency.
You can visit their respective websites for Truflation and the Consumer Price Index by clicking on each hyperlink.
Truflation was created to provide a more accurate, real time inflation calculation. Their initial reported inflation numbers were published in December of 2021.
The CPI is the traditional monthly calculation from the BLS that dates back to 1913. The change in the CPI year over year is how the consumer inflation number is calculated. It is the headline inflation number that you see and hear in the news reports all of the time.
Why is the rate of Inflation important?
If you have been watching or reading the news, inflation has been a top news story for the last few years. The severe supply chain disruptions and government stimulus to combat the Covid-19 global pandemic drove inflation to highs not seen in decades.
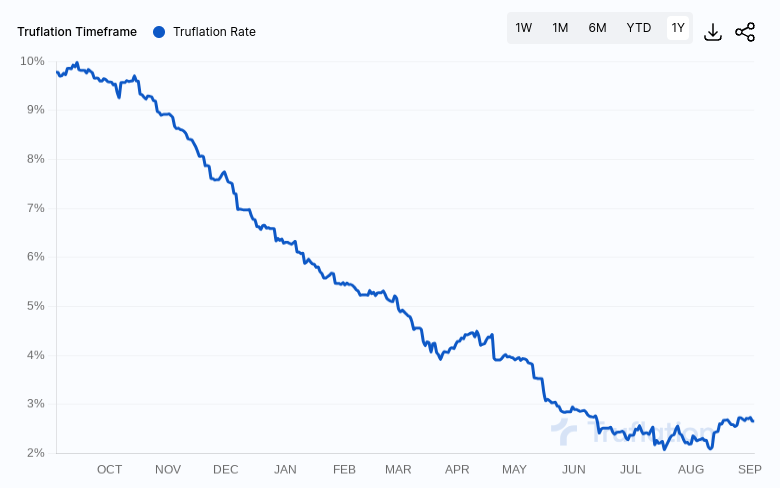
The Federal reserve took action to combat the high inflation by raising interest rates faster than any time in history. The goal is to severely curb consumer demand which will then drive down inflation. To date, the action has been relatively successful, as inflation has reduced from over 9% in 2022 to 3.2% in August of 2023 according to the CPI (2.66% if using Truflation).
The CPI inflation rate has a big impact on the Fed’s monetary policy, which in turn has a big impact on the daily lives of all of us. When the interest rates are raised significantly, it has a huge impact on anyone that has a variable rate interest loan, or wants to take out a new loan. A 30 year fixed $200,000 mortgage loan at 7% has a monthly payment approximately $450 more per month than one at 3%, which has a big impact on a family’s monthly budget.
Inflation impacts our daily lives in the prices we pay for everything; food, housing, transportation and other consumables. It also has a big impact on investors. The Real Return is the amount of total investment gains less the rate of inflation. A huge spike in inflation has investors evaluating and making moves to sustain the highest return in real terms.
After a series of interest rate hikes by the Federal Reserve going back to last year, there is a lot of focus on where interest rates are going next. The stock and bond markets appear to hang on every word coming from the Federal Reserve chairman before and after their central bank meetings. The main commentary you hear lately is that we have to “watch the data” to see what inflation is doing and what action, if any, the Fed will be taking next.
The Value Proposition of the Truflation Index
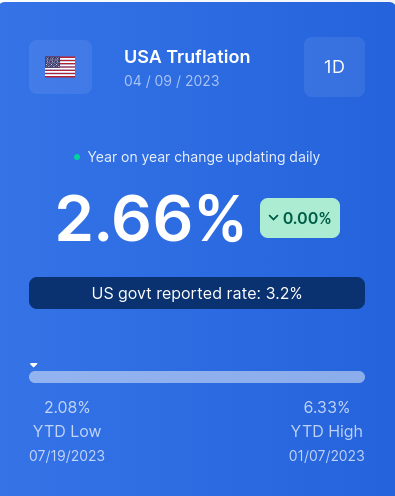
Now is a time where a service such as Truflation can add value to the discussion. Truflation is updated daily via its data sets fed from numerous sources covering all of the inflation categories. This allows anyone to see what the inflation number is every day, along with a chart for the year. Here is a sample from the Truflation website. You can see this live by going directly to their site at Truflation.com.
Having daily data on inflation is one of the big benefits of the Truflation website. The markets do not like uncertainty, and having a daily look at consumer price changes gives everyone another data source during the big time gaps (from last month to this month) between the official numbers reported by the Bureau of Labor Statistics. This will help calm market expectations around what inflation is running at.
How is the Truflation number different than the CPI inflation number?
Truflation touts its calculation as being more accurate than the older traditional CPI method. Truflation updates their methodology each year. They mention that the CPI calculation framework was last updated in 1999, which was a long time ago!
Truflation’s website states: “We utilize modern consumer and spending data sets along with cutting-edge technology to deliver the world’s only verifiable daily inflation indexes.”
Truflation pulls data daily from 30 different sources representing millions of product price data points. The traditional CPI metric only uses about 80,000 products. That’s a big difference!
Truflation’s consumer prices are broken down into twelve categories, along with the relative expenditure weight of each:
- Food & non-alcoholic beverages (15.3%) – food & drink at home & away from home
- Alcohol & Tobacco (2.3%) – beer, wine, spirits & tobacco products
- Clothing & footware (3.8%) – clothing, shoes and other apparel
- Housing (23.2%) – owned, rented and other lodging
- Utilities (5.9%) – natural gas, electricity, fuel oil, water & other public services
- Housing durables and daily use items (7.2%) – household consumables, services, furnishings & equipment
- Health (8.5%) – medical insurance, services, drugs & supplies
- Transportation (19.8%) – vehicle purchases, fuel, maintenance, leases, insurance, public transportation
- Communications (3.2%) – cell phones & land lines
- Recreation & Culture (5.6%) – hobbies, entertainment, fees, admissions, pets
- Education (2.3%) – education & reading
- All Other (2.9%) – personal care products & services, miscellaneous
The Consumer Price Index (CPI) uses the following categories:
- Food and Beverages – meat, milk, beer, wine, snacks, etc
- Housing – Rent or owners’ equivalent rent, fuel oil, furniture, etc
- Apparel – Clothing
- Transportation – Vehicles, airfare, gas, etc.
- Medical Care – Hospital services, drugs, medical supplies, glasses, etc
- Recreation – TV, pets, movies, etc
- Education & Communication – College costs, telephone services, computer software, postage, etc
- Other – smoking products, haircuts & other personal services
Note: The CPI category weighting was not readily available. Energy prices are included in both housing prices and transportation prices.
Data Collection & calculation methods
Truflation’s data providers include: NielsenIQ, Big Mac Index, Amazon, Walmart, Zillow, Trulia, Penn State University Marginal Rent Inflation Index, Real Capital Analytics, Yahoo, Energy Information Administration, OPIS, AAA Gas prices, JD Powers, CarGurus, Numbeo, Statista, CoreLogic, Kantar and others. Setting up a Truflation feed from these and other data providers allows for a fast collection of a tremendous amount of pricing information from independent data sources.
The CPI calculation by the BLS uses data collectors called economic assistants to survey and calculate the inflation rate each month. It has a significant manual component to it. As a result, it is much slower than Truflation.
One advantage of the CPI data from the US Government is its consistency over the years. Since the calculation has been performed the same way and over so many years, the ability to see consistent inflation data over time is valuable for purposes of trend analysis.
Truflation’s calculation has the advantage of full transparency. It uses block-chain technology and open source algorithms that are easily verifiable and tamper proof. The CPI calculations do not have the same level of transparency.
Both calculations use a year over year (YoY) comparison of prices to determine the inflation percentage increase. Truflation did that on purpose, so that its annual inflation rate increase denominator would use the same basis as the CPI for ease of comparison purposes.
How do the inflation rates for Truflation vs CPI compare today?
You can check these for yourself by going to the Truflation website and the BLS website. You will have to do some basic math using the BLS site to get the percentage increase for the latest month reported (percentage change in the year over year index number). Truflation helps you out by also showing the CPI inflation percentage on their website.
As you can see from the image earlier in this article, Truflation is showing an annual inflation increase of 2.66% vs the latest CPI reported rate of 3.2%. The Truflation number is as of the date (Sept 4, 2023) since it is updated daily. The CPI is from the last monthly reported number, which was about three weeks prior.
If both calculations have value, Truflation can be seen as the leading indicator inflation metric, whereas the CPI would be the lagging metric due to the time delay of calculating and reporting. One way to use both is to watch the Truflation inflation measure for the current rate and then use the CPI to validate the reasonableness when it is issued later.
Executive Summary: How is Trulfation different different from the CPI index?
- Truflation is new from 2021 vs the CPI since 1913
- Truflation is calculated by private industry vs the CPI which is provided by the US Bureau of Labor Statistics
- Truflation provides transparent access to their calculation via their Block Chain methodology
- The CPI uses data collectors called economic assistants to survey and calculate the inflation rate, which is less visible
- The CPI has the benefit of consistent reporting every month from 1913 for trend analysis, whereas Truflation is new since 2021
- Truflation data includes millions of consumer prices, whereas the CPI uses approximately 80,000
- Truflation is calculated daily due to its automated data feeds vs the CPI which is calculated once a month
- Truflation could be used as a leading indicator of the inflation rate, whereas the CPI can we used as a lagging validation of the rate.